Fields to Freeways: How Satellite-Driven GIS Analysis Is Rewriting What We Know About Farmland Loss in America

Photo: Vasyatka1, CC BY-SA 4.0, via Wikimedia Commons
For decades, America's agricultural land loss has been measured through a patchwork of county surveys, census data, and periodic federal assessments — tools designed for a slower, more legible era of development. But the landscape has outpaced the methodology. Today, geospatial analysts armed with high-resolution satellite imagery, machine learning classification models, and temporal mapping techniques are arriving at a deeply unsettling conclusion: the country has been significantly underestimating how quickly farmland is disappearing beneath subdivisions, distribution centers, and asphalt.
The implications reach far beyond agriculture. Food security, water table stability, regional climate patterns, and rural community viability are all bound to the fate of productive agricultural soil. And if the GIS data is correct, that soil is vanishing at roughly twice the rate that traditional surveying methods have recorded.
The Measurement Gap
The United States Department of Agriculture's National Resources Inventory, widely considered the authoritative source on land use change, conducts assessments on a multi-year cycle using statistical sampling methods. While rigorous by the standards of its design, the NRI was never built to capture granular, parcel-level conversion events in real time. A warehouse breaking ground on former cornfields in Indiana or a master-planned community absorbing citrus groves in Central Florida may not register meaningfully in aggregate data until years after the fact.
Geospatial analysts have begun quantifying this measurement gap by layering USDA data against satellite-derived land cover classifications drawn from sources such as the USGS National Land Cover Database, ESA Sentinel-2 imagery, and commercial high-resolution providers. The results consistently show that the official tallies lag behind observable reality — sometimes by margins significant enough to alter policy conclusions entirely.
In several rapidly growing metropolitan corridors, GIS-based assessments have identified agricultural land conversion rates 40 to 100 percent higher than what contemporaneous federal datasets reflected. These are not rounding errors. They represent millions of acres of productive soil reclassified not in the field, but in a server farm, long after the land itself has been paved over.
Temporal Mapping and the Anatomy of Sprawl
One of the most powerful tools in the geospatial analyst's arsenal for tracking farmland loss is temporal change detection — the process of comparing satellite imagery captured at different points in time to identify land cover transitions. By stacking imagery from the Landsat archive, which extends back to the early 1970s, analysts can reconstruct the precise trajectory of development across any given landscape.
Applied to metropolitan fringe zones — the transitional areas where city infrastructure meets working farmland — temporal mapping reveals patterns that defy the conventional narrative of compact urban growth. Sprawl does not advance in a uniform wave. It leapfrogs. A logistics park appears five miles beyond the last subdivision. A retail corridor anchors a new residential cluster further out still. Each node generates its own gravitational pull, drawing roads, utilities, and eventually denser development behind it.
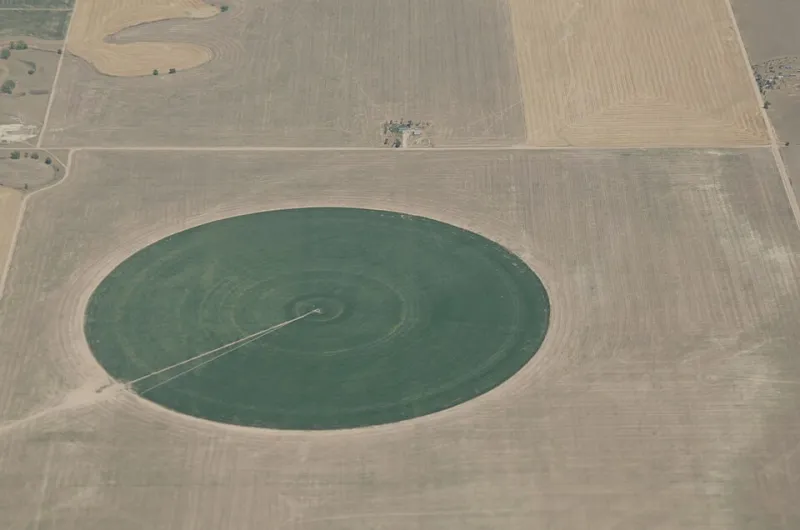
This fragmented pattern is precisely what makes it so difficult to track through traditional survey methods, and so legible through satellite-based geospatial analysis. The land cover signature of a freshly graded former farm field is unmistakable from orbit — a stark, geometrically regular expanse of disturbed earth surrounded by the spectral signatures of remaining vegetation.
In the Phoenix metropolitan area, temporal analysis spanning the past two decades reveals agricultural land conversion accelerating not linearly but exponentially during specific economic cycles, with the 2010s recovery period and the post-2020 Sun Belt migration surge each triggering distinct waves of fringe development that consumed irrigated farmland in Maricopa and Pinal counties at rates that local planning documents had not anticipated.
Case Study: The Mid-Atlantic Corridor
The region stretching from Northern Virginia through Delaware and into Southern New Jersey represents one of the most geospatially complex farmland loss scenarios in the country. Agricultural land here exists in close proximity to some of the Eastern Seaboard's most intense development pressure — proximity to Washington, D.C., Philadelphia, and New York City creates a multi-directional pull on rural land markets that conventional planning models struggle to represent.
GIS analysts working with county-level parcel data integrated against NLCD change products have documented that the agricultural footprint in this corridor has contracted substantially faster than state-level land use reports indicated, with conversion events frequently occurring in parcels too small or too scattered to trigger formal review processes. Precision agriculture mapping layers, originally developed to optimize crop management, have been repurposed to establish historical baselines against which current satellite imagery is compared — producing conversion timelines accurate to within a single growing season.
The practical consequence is that regional food system planners operating on the assumption that certain productive areas remain viable agricultural zones are, in some cases, working from maps that no longer reflect the ground truth.
How GIS Professionals Are Sounding the Alarm
Across the country, a growing coalition of geospatial professionals, land trust organizations, and university-based researchers are using location intelligence platforms to build early warning systems for agricultural land conversion. The core methodology involves establishing a set of spatial precursor indicators — road extension permits, utility corridor filings, zoning variance applications, and speculative land transactions — that historically precede development activity by twelve to thirty-six months.
By geocoding these administrative events and overlaying them against high-value agricultural soil classifications drawn from USDA's Web Soil Survey, analysts can identify parcels at elevated conversion risk before a single survey stake is driven. The resulting risk maps are being shared with state agricultural commissions, land conservation nonprofits, and in some cases, directly with county planning boards.
The goal is not to halt development categorically, but to ensure that the most irreplaceable agricultural assets — prime farmland soils with limited substitution potential — are identified with enough lead time to allow conservation tools such as agricultural easements, purchase of development rights programs, and transfer of development rights mechanisms to be deployed effectively.
Time, in this context, is a spatial variable. The earlier a parcel appears on a risk map, the wider the range of policy options available to preserve it.
A Data Problem with Real-World Consequences
The farmland loss story that GIS data is now telling is not simply a corrective to a statistical undercount. It is a signal that the systems Americans rely upon to understand and govern the land are operating on information that is structurally outdated relative to the pace of change on the ground.
Geospatial technology does not resolve the policy debates around land use, development rights, or food system resilience. Those remain contested questions embedded in deep economic and political tensions. What it does do is sharpen the factual foundation on which those debates must be conducted. When the true rate of agricultural land conversion is twice what official sources suggest, every subsequent conversation about food security, rural economic development, and sustainable growth is operating on a different set of stakes.
For GIS professionals, the mandate is clear: build the temporal datasets, refine the classification models, and put the maps in front of the people who make decisions before the fields in question exist only in historical imagery archives.