Ahead of the Wave: How GIS Is Charting America's Climate Displacement Zones Before the Crisis Arrives
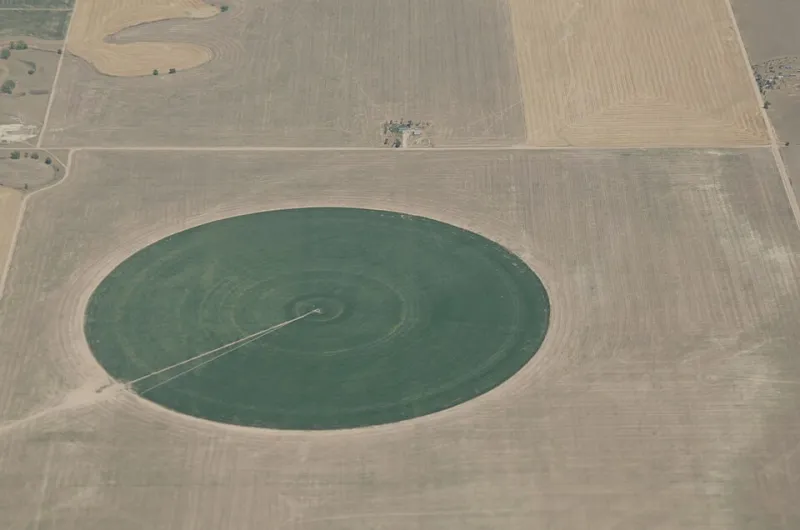
Photo: Lance Cheung/USDA, Public domain, via Wikimedia Commons
For most Americans, the idea of abandoning a home due to climate pressure still feels abstract—a distant consequence reserved for coastal villages in the developing world. Yet the data tells a different story. Geospatial analysts working across federal agencies, university research centers, and private risk firms are assembling a sobering cartographic record: a layered, high-resolution portrait of communities across the United States that face mounting environmental stressors severe enough to trigger sustained, large-scale outmigration within the next two to three decades.
The discipline of location intelligence is proving uniquely suited to this challenge. Unlike traditional demographic modeling, which relies heavily on historical migration patterns, GIS-based climate risk analysis synthesizes real-time environmental data—drought indices, storm surge projections, wildfire ignition probability scores—with socioeconomic vulnerability indicators to generate forward-looking displacement risk assessments. The result is a map not of where people are moving, but of where they are likely to move from, and why.
Drought, Depletion, and the Southwest's Shrinking Margin
No region illustrates the urgency of this analysis more clearly than the American Southwest. The Colorado River Basin, which supplies drinking and irrigation water to approximately 40 million people across seven states, is operating at a deficit that geospatial monitoring systems have been tracking with increasing alarm. Remote sensing data from NASA's GRACE satellite mission—which measures gravitational anomalies caused by shifts in groundwater mass—has documented dramatic aquifer depletion across Arizona, Nevada, and Southern California over the past two decades.
When analysts overlay this hydrological data with population density maps and municipal water dependency indices, certain communities emerge as acutely exposed. Smaller agricultural towns in Arizona's Pinal County, for instance, face a confluence of depleted groundwater reserves, reduced Colorado River allocations, and limited economic diversification—a combination that GIS risk models flag as a precursor to population contraction. Phoenix and Tucson, though better capitalized, are contending with their own infrastructure stress signals that spatial analysis is beginning to quantify in granular detail.
Planners in the region are responding. Several Arizona municipalities have contracted with geospatial consulting firms to build water stress dashboards that integrate real-time reservoir levels, projected demand curves, and land-use zoning layers. These tools allow city planners to simulate the downstream effects of continued drought on residential development corridors—essentially asking, at a parcel level, which neighborhoods are viable in a significantly drier future.
Wildfire Corridors and the Geometry of Forced Relocation
In the West and increasingly across the South, wildfire risk has emerged as a parallel displacement driver with its own distinct spatial logic. The wildland-urban interface—the zone where developed land meets fire-prone vegetation—has expanded dramatically as suburban growth has pushed into formerly rural terrain. GIS platforms now map this interface at a resolution precise enough to identify individual subdivisions that sit within high-probability ignition corridors.
California's experience has become a case study in the policy consequences of this kind of spatial intelligence. Following the catastrophic 2018 Camp Fire, which destroyed the town of Paradise and displaced nearly 50,000 residents, state agencies and insurance regulators began using fire behavior modeling software integrated with GIS platforms to reassess risk at the census-tract level. The resulting maps have informed decisions that are already reshaping the state's housing landscape: insurers withdrawing coverage from high-risk ZIP codes, lenders adjusting mortgage terms for properties in fire-prone areas, and county planning departments revising building permit approvals for new construction in the wildland-urban interface.
The broader implication is significant. When private capital—insurance coverage, mortgage availability—retreats from a geography based on geospatial risk data, the conditions for displacement are established well before any single fire event occurs. GIS is not merely documenting climate risk; it is, in a very direct sense, shaping the economic forces that determine whether communities remain viable.
Sea-Level Rise and the Atlantic Coast's Receding Baseline
Along the Eastern Seaboard, the displacement calculus is driven by a different but equally well-mapped threat. NOAA's sea-level rise projections, now integrated into multiple GIS platforms as downloadable raster layers, allow analysts to model inundation scenarios at intervals ranging from current conditions to a two-meter rise by 2100. When these projections are combined with property value databases, flood insurance claim histories, and storm surge modeling outputs, the resulting risk surfaces reveal communities whose long-term habitability is genuinely in question.
Miami-Dade County has become one of the most extensively mapped climate risk environments in the country. The county's low elevation, porous limestone geology, and exposure to Atlantic storm systems create a compound vulnerability that GIS analysts have documented in considerable detail. Municipal planners there have used spatial analysis to identify neighborhoods where repetitive flood losses, combined with rising insurance premiums and saltwater intrusion into freshwater infrastructure, are already generating measurable population pressure. The term used increasingly in planning circles—"managed retreat"—refers to a policy framework that geospatial data is helping to operationalize: identifying which areas to reinforce, which to allow to gradually depopulate, and where to direct resettlement investment.
Further north, communities along the Outer Banks of North Carolina and the barrier islands of South Carolina face analogous pressures. Geospatial analysis of shoreline change rates, derived from decades of aerial and satellite imagery, reveals that some of these communities are losing land area measurably faster than public discourse acknowledges.
From Risk Maps to Policy Architecture
The translation of GIS-derived climate risk data into actionable policy represents perhaps the most consequential frontier in this field. Federal agencies including FEMA, HUD, and the EPA have each invested in expanding their geospatial analytical capacity in recent years, and the Biden-era Justice40 initiative explicitly incorporated spatial equity analysis into the distribution of climate resilience funding—directing resources toward communities identified through GIS modeling as both highly vulnerable and historically underinvested.
At the state level, several governments are developing what analysts describe as climate migration receiving frameworks: spatial plans that identify interior communities with the infrastructure capacity, water resources, and economic base to absorb population inflows from higher-risk regions. Michigan, Minnesota, and Wisconsin—states with relative water abundance and lower wildfire exposure—have begun appearing in this kind of analysis as potential destinations, and their planning agencies are beginning to use GIS tools to assess absorption capacity.
For the private sector, the implications are equally profound. Real estate developers, infrastructure investors, and financial institutions are incorporating geospatial climate risk scores into due diligence workflows at an accelerating pace. The emerging discipline of climate-adjusted location intelligence—assessing not just where demand exists today, but where environmental conditions will support sustained habitation over a 30-year investment horizon—is reshaping capital allocation decisions in ways that will have lasting effects on the American built environment.
The Map as Early Warning System
What geospatial science offers, above all else, is lead time. The physical processes driving climate-related displacement—aquifer depletion, shoreline erosion, expanding fire seasons—unfold over years and decades, not overnight. The communities, institutions, and policymakers that engage seriously with the spatial data now have a window to act that will not remain open indefinitely.
The maps exist. The analytical frameworks are maturing rapidly. The question facing planners, investors, and elected officials is whether they will treat this intelligence as the early warning system it was designed to be—or wait until the displacement it depicts has already begun.