Beneath the Surface: How Geospatial Intelligence Is Exposing the Quiet Collapse of America's Groundwater Reserves
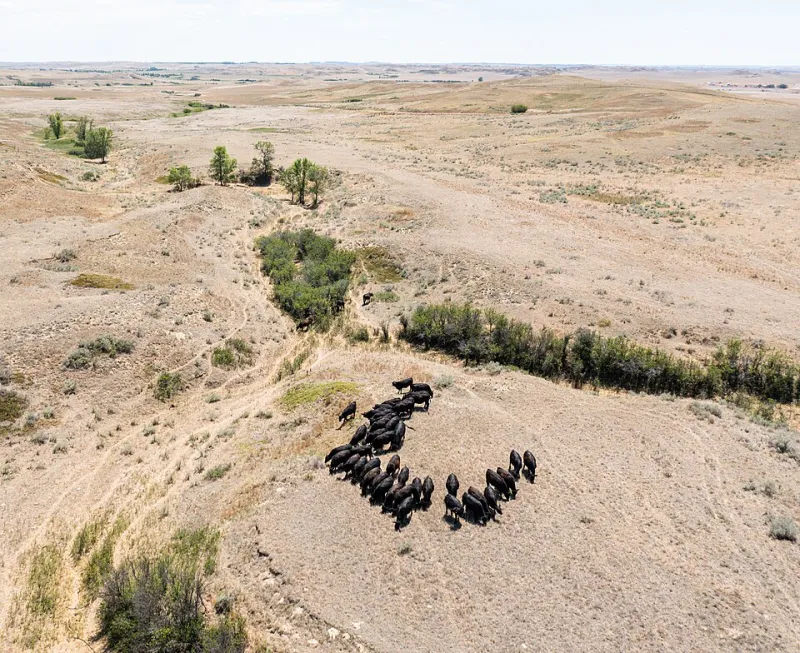
Photo: USDA NRCS Montana, Public domain, via Wikimedia Commons
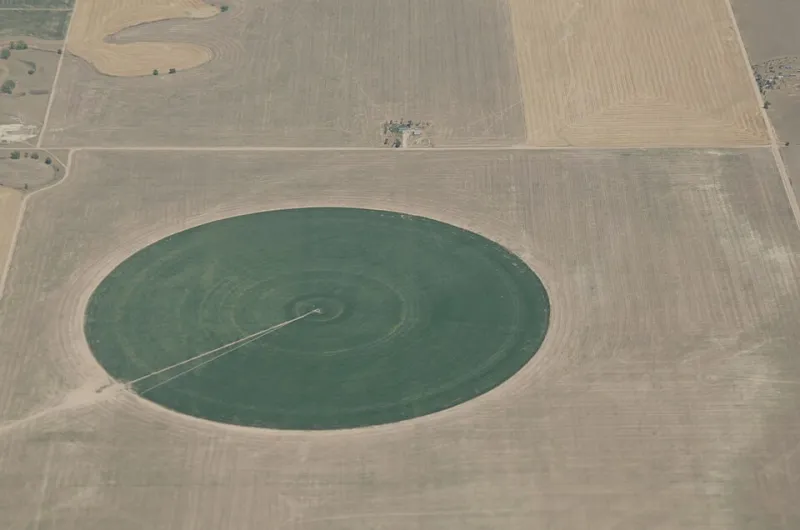
Water does not announce its disappearance. It recedes slowly, invisibly, through thousands of private wells and irrigation pumps scattered across millions of acres. For generations, that invisibility allowed unsustainable extraction to continue largely unchallenged—not because regulators were indifferent, but because the spatial reality of aquifer depletion was genuinely difficult to see. Geospatial technology is now removing that excuse.
Across the High Plains, the Colorado River Basin, and the agricultural valleys of California, GIS platforms are assembling well-log data, satellite-derived land subsidence measurements, and hydrological models into coherent, navigable maps that reveal groundwater stress at a scale and precision that was simply unavailable a decade ago. The picture that emerges is, in many places, deeply sobering.
The Ogallala Problem, Rendered in Detail
No aquifer in the United States carries more economic and cultural weight than the Ogallala, the vast underground reservoir stretching beneath eight states from South Dakota to Texas. It irrigates roughly 30 percent of all groundwater-fed agriculture in the country. It is also being depleted far faster than natural recharge can replace it.
That much has been known in general terms for years. What GIS analysis is now providing is granular, county-level, and in some cases parcel-level visibility into where depletion is most severe, how quickly saturated thickness is declining, and which communities face well failures within a defined planning horizon.
Kansas-based water management districts have used spatial analysis tools to overlay decades of well-measurement records against crop coverage data derived from satellite imagery, generating maps that correlate intensive irrigation footprints with accelerated water table decline. The resulting visualizations have shifted conversations in state legislatures from abstract warnings about long-term sustainability to concrete discussions about specific townships where the aquifer may become economically unviable for irrigation within 25 years.
For professionals working in water resource planning, this distinction matters enormously. A general trend line in a spreadsheet produces one kind of policy response. A map that pinpoints the townships where extraction rates exceed recharge by a factor of ten produces another.
Subsidence as a Spatial Signal
In California's San Joaquin Valley, the consequences of over-extraction are not merely hydrological—they are physical. Land subsidence driven by groundwater pumping has caused portions of the valley floor to sink by as much as 28 feet over the past century, with measurable drops continuing today. Infrastructure built to deliver water across this landscape—canals, pipelines, bridge abutments—is being deformed by the very extraction it was designed to support.
NASA's GRACE satellite mission, which measures gravitational anomalies caused by shifting water mass, has provided a continental-scale view of groundwater loss. But it is the integration of GRACE data with Interferometric Synthetic Aperture Radar (InSAR) imagery and local well measurements inside GIS environments that has enabled state agencies to move from broad awareness to actionable spatial intelligence.
The California Department of Water Resources and several Groundwater Sustainability Agencies formed under the 2014 Sustainable Groundwater Management Act now rely on these integrated spatial datasets to define basin boundaries, identify critical overdraft areas, and evaluate the adequacy of submitted sustainability plans. The law itself mandates a geospatial logic: sustainability must be demonstrated at the basin level, which requires understanding the basin as a geographic object with defined boundaries, recharge zones, and extraction patterns.
Where Traditional Management Fell Short
It would be unfair to characterize earlier water management as simply negligent. The institutional frameworks governing groundwater in the United States evolved in an era when data collection was expensive, slow, and spatially coarse. Many western states still operate under prior appropriation doctrines that were designed for surface water and fit underground resources awkwardly at best.
Moreover, groundwater management in the US remains fragmented across a patchwork of state agencies, local districts, and tribal authorities, each maintaining its own data systems with varying standards, coverage, and update frequencies. That fragmentation meant that even when individual monitoring wells produced useful readings, the data rarely flowed into a coherent regional picture.
GIS platforms are not a political solution to that fragmentation, but they are increasingly functioning as a technical bridge. Cloud-based geospatial environments allow datasets from disparate sources—USGS National Water Information System records, state well logs, remote sensing products, agricultural water use estimates—to be ingested, normalized, and visualized in common reference frames. Analysts who previously spent weeks reconciling incompatible datasets can now surface spatial patterns in hours.
Case Study: The Texas Panhandle's Planning Pivot
The Texas Water Development Board's Groundwater Availability Modeling program offers a instructive example of GIS-informed policy recalibration. Using spatially explicit groundwater flow models tied to geographic information systems, the program generates managed available groundwater estimates for each of the state's designated groundwater management areas.
For Panhandle communities heavily dependent on Ogallala water, these models have produced uncomfortable but necessary clarity. Several groundwater conservation districts have used the spatial outputs to implement tiered pumping rules, prioritize recharge enhancement projects in zones where subsurface geology makes artificial recharge feasible, and—most significantly—begin conversations with agricultural stakeholders about voluntary fallowing programs in areas where continued extraction threatens the economic viability of the entire district.
None of these conversations are easy. Agriculture is the economic foundation of many Panhandle communities, and restrictions on water use carry real human costs. But GIS mapping has shifted the terms of those conversations from speculation to evidence, from anecdote to spatial fact.
The Tools Reshaping the Field
For GIS professionals working in water resources, the current technology landscape offers capabilities that would have been operationally out of reach for most agencies just a few years ago. Cloud-native GIS platforms now support the processing of large-scale remote sensing datasets without requiring local high-performance computing infrastructure. Machine learning pipelines applied to well-log archives can identify spatial patterns in historical drawdown data that manual analysis would miss. Digital twin environments allow planners to simulate the spatial effects of different extraction scenarios across a basin before committing to regulatory action.
Interoperability standards, including OGC-compliant web services and standardized data exchange formats, are gradually making it easier to connect state monitoring networks with federal databases and academic research outputs. The US Geological Survey's Water Resources Mission Area has invested significantly in making its national datasets more accessible through API-driven interfaces compatible with leading GIS platforms.
A Narrowing Window
The honest assessment of where the US stands on groundwater management is this: geospatial technology has dramatically improved the nation's ability to see the problem. Whether that visibility translates into policy action at the speed the hydrology demands remains an open question.
In the most stressed portions of the Ogallala region, even aggressive conservation measures begun today cannot restore what has already been extracted. The aquifer's natural recharge rate in much of the southern High Plains is measured in fractions of an inch per year. The question GIS mapping is now forcing onto the table is not whether these communities will face a water transition, but how much spatial intelligence they will bring to managing it.
For location intelligence professionals, that framing defines the work ahead: building the data infrastructure, analytical frameworks, and visualization tools that allow water managers, elected officials, and communities to make consequential decisions with their eyes fully open to the geographic reality beneath their feet.