Fifteen Degrees Apart: Inside the Block-Level Maps of Urban Heat
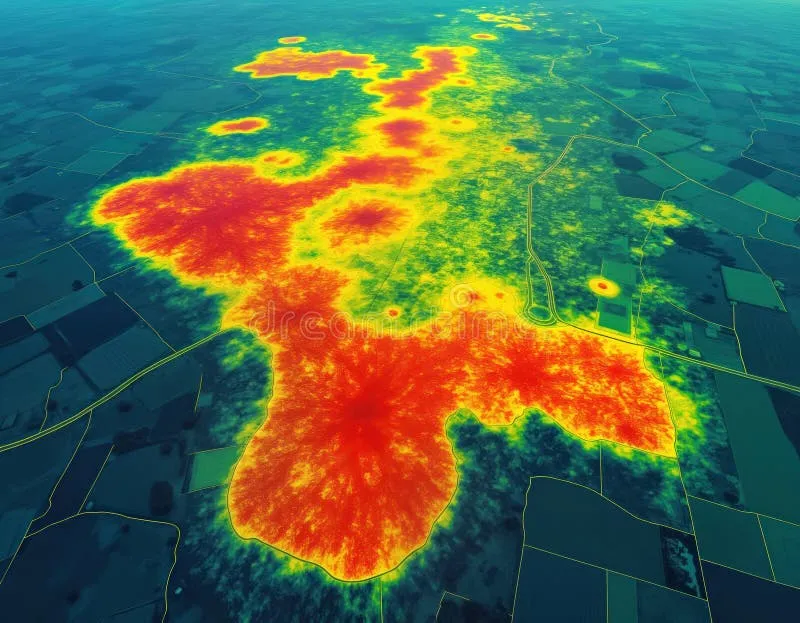
Photo: urban heat island thermal map city temperature aerial, via thumbs.dreamstime.com
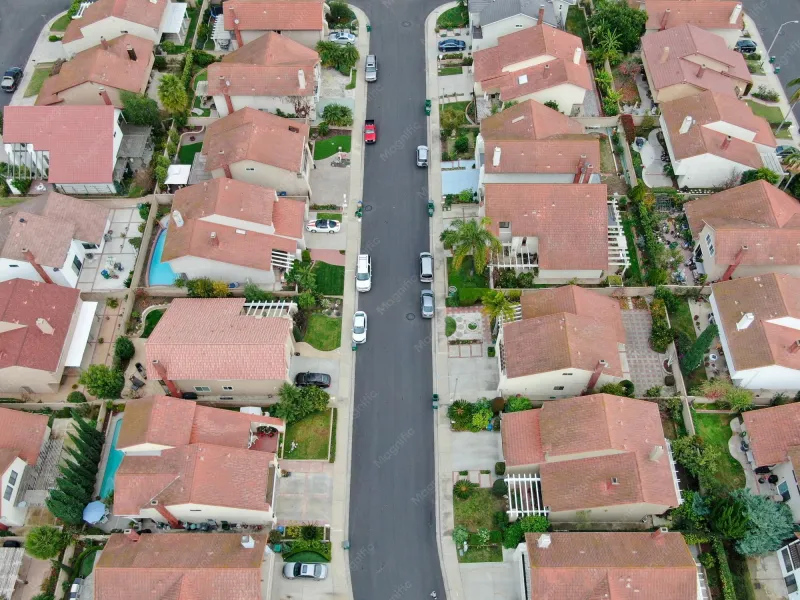
On a July afternoon in Phoenix, two residents within the same neighborhood can experience temperatures fifteen degrees Fahrenheit apart. One lives under a mature canopy of mesquite and ash; the other, six blocks away, walks home across unshaded asphalt and dark aggregate roofs. Both live in the same city, the same climate zone, the same zip code. Only the micro-geometry of their surroundings differs.
That difference is now mappable at extraordinary resolution, and the maps are changing how American cities fight heat.
Why Citywide Averages Hide the Story
Traditional heat data comes from weather stations, typically sited at airports or open ground, reporting a single temperature for an entire metro. These readings are useful for forecasting and nearly useless for exposure. Urban heat is generated and absorbed at the scale of the block: a parking lot radiates differently than a tree-lined street; a corridor of warehouses traps heat that a park releases.
Satellite thermal imagery, particularly from Landsat and ECOSTRESS instruments aboard the International Space Station, captures surface temperature at increasingly fine resolution. But surface temperature alone is incomplete — roofs read hotter than the air at street level. The most rigorous work fuses satellite thermal data with aerial imagery classified by land cover, LiDAR-derived canopy height, and parcel-level zoning data. The output is a heat map in the literal sense: surface temperature attributed to every roof, road, and lawn in the city.
Three Cities, Three Methods
Phoenix runs one of the most developed heat-mapping programs in the country, anchored by Arizona State University's urban climate research and the city's Office of Heat Response and Mitigation — the first of its kind in the United States. Volunteers have conducted annual heat walks with instruments, ground-truthing satellite estimates at street level. The mapped results feed directly into the city's Cool Corridors program, which prioritizes shade investment along the blocks with the highest measured heat exposure and heaviest pedestrian traffic.
Atlanta approaches the problem through its canopy. The city's famous tree cover is unevenly distributed — abundant in wealthier northside neighborhoods, sparse along some southside corridors — and thermal mapping has made that inequity quantifiable. The city's Tree Protection Ordinance update drew on canopy and temperature layers to argue that shade is infrastructure, not amenity, and that its absence carries a measurable cost in specific, named places.
Chicago pairs heat mapping with vulnerability analysis. Following the catastrophic 1995 heat wave that killed more than 700 residents, researchers established that mortality concentrated in neighborhoods with sparse canopy and low rates of air conditioning access. The city now overlays thermal data with social vulnerability indices, producing composite maps that identify where high heat and high risk intersect — and directing cooling resources accordingly.
The Fix Is Often a Tree, Correctly Placed
What emerges from all three cities is a strikingly practical conclusion. The most cost-effective heat intervention is not a megaproject; it is targeted vegetation, placed where the map says it matters most. Shade over a sidewalk reduces surface temperature dramatically. Reflective roofing lowers nighttime release. Cool pavement helps, but its benefits are localized and modest compared to canopy.
The blocker is rarely technology. Thermal data is publicly available, and the analytical workflows are well documented. The blocker is that heat maps make visible a disparity cities have long preferred vague: the hottest blocks are, with remarkable consistency, the poorest and least green. A tree-planting map, drawn honestly, is a map of historical disinvestment.
That may be precisely why it works as policy. "Plant more trees" is a platitude. "Plant 2,400 trees along the corridors highlighted in Figure 4, prioritized by surface temperature and pedestrian counts" is a budget line. Geospatial analysis converts an abstract climate problem into an addressable one — and, block by block, gives the hottest places in America something they have not had in decades: a specific, funded plan for cooling down.